In this section, we will learn how to write equations for linear functions given different pieces of information, including two points on the line and the graph of the line. We will also identify the equations of horizontal and vertical lines and write linear equations from written information.
We have seen that we can define the slope of a line given two points on the line, and use that information along with the y-intercept to graph the line. If you don't know the y-intercept, or the equation for the line you can use two points to define the equation of the line using the point-slope formula.
This is an important formula, as it will be used in other areas of college algebra and often in calculus to find the equation of a tangent line. We need only one point and the slope of the line to use the formula. After substituting the slope and the coordinates of one point into the formula, we simplify it and write it in slope-intercept form.
In our first example, we will start with the slope, then we will show how to find the equation of a line without being given the slope.
Write the equation of the line with slope [latex]m=-3[/latex] and passing through the point [latex]\left(4,8\right)[/latex]. Write the final equation in slope-intercept form.
Answer: Using the point-slope formula, substitute [latex]-3[/latex] for m and the point [latex]\left(4,8\right)[/latex] for [latex]\left(_,_\right)[/latex].
[latex]\beginy-_=m\left(x-_\right)\hfill \\ y - 8=-3\left(x - 4\right)\hfill \\ y - 8=-3x+12\hfill \\ y=-3x+20\hfill \end[/latex]
Note that any point on the line can be used to find the equation. If done correctly, the same final equation will be obtained.
In our next example we will start with two points and define the equation of the line that passes through them.
Find the equation of the line passing through the points [latex]\left(3,4\right)[/latex] and [latex]\left(0,-3\right)[/latex]. Write the final equation in slope-intercept form.
Answer: First, we calculate the slope using the slope formula and two points.
[latex]\beginm\hfill=\frac\hfill \\ \hfill =\frac\hfill \\ \hfill =\frac\hfill \end[/latex]
Next, we use the point-slope formula with the slope of [latex]\frac[/latex], and either point. Let’s pick the point [latex]\left(3,4\right)[/latex] for [latex]\left(_,_\right)[/latex].
[latex]\beginy - 4=\frac\left(x - 3\right)\hfill \\ y - 4=\fracx - 7\hfill&\text\frac.\hfill \\ y=\fracx - 3\hfill \end[/latex]
In slope-intercept form, the equation is written as [latex]y=\fracx - 3[/latex]. To prove that either point can be used, let us use the second point [latex]\left(0,-3\right)[/latex] and see if we get the same equation.
[latex]\beginy-\left(-3\right)=\frac\left(x - 0\right)\hfill \\ y+3=\fracx\hfill \\ y=\fracx - 3\hfill \end[/latex]
We see that the same line will be obtained using either point. This makes sense because we used both points to calculate the slope.
The following video examples shows how to write the equation for a line given it's slope and a point on the line. https://youtu.be/vut5b2fRQQ0
Another way that we can represent the equation of a line is in standard form. Standard form is given as
where [latex]A[/latex], [latex]B[/latex], and [latex]C[/latex] are integers. The x- and y-terms are on one side of the equal sign and the constant term is on the other side.
Find the equation of the line with [latex]m=-6[/latex] and passing through the point [latex]\left(\frac<1>,-2\right)[/latex]. Write the equation in standard form.
Answer: We begin using the point-slope formula.
[latex]\beginy-\left(-2\right)=-6\left(x-\frac\right)\hfill \\ y+2=-6x+\frac\hfill \end[/latex]
From here, we multiply through by 2, as no fractions are permitted in standard form, and then move both variables to the left aside of the equal sign and move the constants to the right.
[latex]\begin2\left(y+2\right)=\left(-6x+\frac\right)2\hfill \\ 2y+4=-12x+3\hfill \\ 12x+2y=-1\hfill \end[/latex]
This equation is now written in standard form.
The equations of vertical and horizontal lines do not require any of the preceding formulas, although we can use the formulas to prove that the equations are correct. The equation of a vertical line is given as
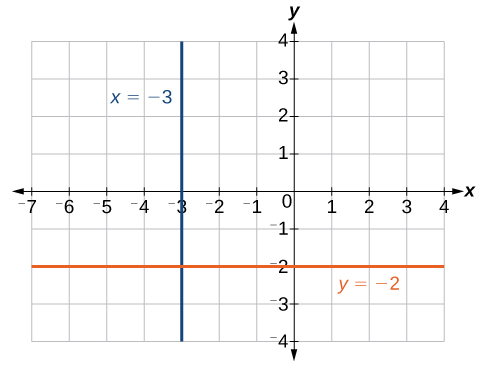
where c is a constant. The slope of a vertical line is undefined, and regardless of the y-value of any point on the line, the x-coordinate of the point will be c. Suppose that we want to find the equation of a line containing the following points: [latex]\left(-3,-5\right),\left(-3,1\right),\left(-3,3\right)[/latex], and [latex]\left(-3,5\right)[/latex]. First, we will find the slope.
Zero in the denominator means that the slope is undefined and, therefore, we cannot use the point-slope formula. However, we can plot the points. Notice that all of the x-coordinates are the same and we find a vertical line through [latex]x=-3[/latex]. The equation of a horizontal line is given as
where c is a constant. The slope of a horizontal line is zero, and for any x-value of a point on the line, the y-coordinate will be c. Suppose we want to find the equation of a line that contains the following set of points: [latex]\left(-2,-2\right),\left(0,-2\right),\left(3,-2\right)[/latex], and [latex]\left(5,-2\right)[/latex]. We can use the point-slope formula. First, we find the slope using any two points on the line.
Use any point for [latex]\left(_,_\right)[/latex] in the formula, or use the y-intercept.
[latex]\beginy-\left(-2\right)=0\left(x - 3\right)\hfill \\ y+2=0\hfill \\ y=-2\hfill \end[/latex]
The graph is a horizontal line through [latex]y=-2[/latex]. Notice that all of the y-coordinates are the same.

The line [latex]x=−3[/latex] is a vertical line. The line [latex]y=−2[/latex] is a horizontal line.
Find the equation of the line passing through the given points: [latex]\left(1,-3\right)[/latex] and [latex]\left(1,4\right)[/latex].
Answer: The x-coordinate of both points is 1. Therefore, we have a vertical line, [latex]x=1[/latex].
Our last video show another example of writing the equation of a line given two points on the line. https://youtu.be/ndRpJxdmZJI
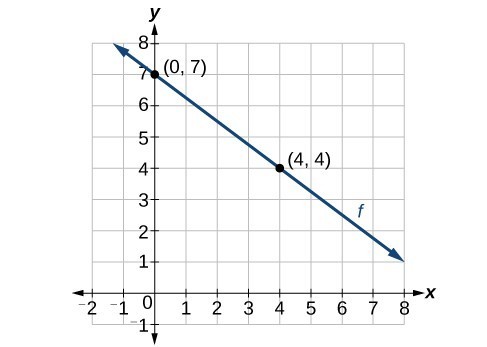
Now that we have written equations for linear functions in both the slope-intercept form and the point-slope form, we can choose which method to use based on the information we are given. That information may be provided in the form of a graph, a point and a slope, two points, and so on. Look at the graph of the function f below.

The function f passing through the points (0.7) and (4,4) with a negative slope.
We are not given the slope of the line, but we can choose any two points on the line to find the slope. Let’s choose (0, 7) and (4, 4). We can use these points to calculate the slope.
[latex]\beginNow we can substitute the slope and the coordinates of one of the points into the point-slope form.
[latex]\beginIf we want to rewrite the equation in the slope-intercept form, we would find
[latex]\begin

Rewrite the equation in slope intercept form.
If we wanted to find the slope-intercept form without first writing the point-slope form, we could have recognized that the line crosses the y-axis when the output value is 7. Therefore, b = 7. We now have the initial value b and the slope m so we can substitute m and b into the slope-intercept form of a line.
So the function is [latex]f\left(x\right)=-\fracx+7[/latex], and the linear equation would be [latex]y=-\fracx+7[/latex].

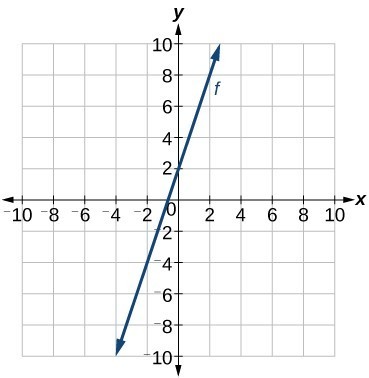
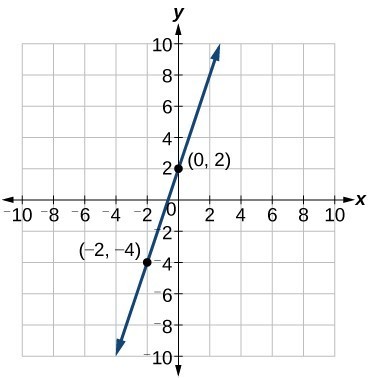
Write an equation for a linear function given a graph of f shown below.
Identify two points on the line, such as (0, 2) and (–2, –4). Use the points to calculate the slope.
Substitute the slope and the coordinates of one of the points into the point-slope form.
We can use algebra to rewrite the equation in the slope-intercept form.
[latex]\begin
This makes sense because we can see from the graph below that the line crosses the y-axis at the point (0, 2), which is the y-intercept, so b = 2. In the following video we show an example of how to write the equation of a line given it's graph. https://youtu.be/mmWf_oLTNSQ
If f is a linear function, with [latex]f\left(3\right)=-2[/latex] , and [latex]f\left(8\right)=1[/latex], find an equation for the function in slope-intercept form.
We can write the given points using coordinates.
[latex]\begin
We can then use the points to calculate the slope.
[latex]\beginSubstitute the slope and the coordinates of one of the points into the point-slope form.
[latex]\begin
We can use algebra to rewrite the equation in the slope-intercept form.
In the video we show another example of how to write a linear function given two points written with function notation. https://youtu.be/TSIcryAtCmY
In the real world, problems are not always explicitly stated in terms of a function or represented with a graph. Fortunately, we can analyze the problem by first representing it as a linear function and then interpreting the components of the function. As long as we know, or can figure out, the initial value and the rate of change of a linear function, we can solve many different kinds of real-world problems.
Marcus currently has 200 songs in his music collection. Every month, he adds 15 new songs. Write a formula for the number of songs, N, in his collection as a function of time, t, the number of months. How many songs will he own in a year?
The initial value for this function is 200 because he currently owns 200 songs, so N(0) = 200, which means that b = 200.

Figure 12
The number of songs increases by 15 songs per month, so the rate of change is 15 songs per month. Therefore we know that m = 15. We can substitute the initial value and the rate of change into the slope-intercept form of a line.
We can write the formula [latex]N\left(t\right)=15t+200[/latex].
With this formula, we can then predict how many songs Marcus will have in 1 year (12 months). In other words, we can evaluate the function at t = 12.
[latex]\begin
Marcus will have 380 songs in 12 months.
Notice that N is an increasing linear function. As the input (the number of months) increases, the output (number of songs) increases as well.
In our next example, we will show that you can write the equation for a linear function given two data points. In this case, Ilya's weekly income depends on the number of insurance policies he sells. We are given his income for two different weeks and the number of policies sold. We first find the rate of change and then solve for the initial value.
Working as an insurance salesperson, Ilya earns a base salary plus a commission on each new policy. Therefore, Ilya’s weekly income, I, depends on the number of new policies, n, he sells during the week. Last week he sold 3 new policies, and earned $760 for the week. The week before, he sold 5 new policies and earned $920. Find an equation for I(n), and interpret the meaning of the components of the equation.
The given information gives us two input-output pairs: (3, 760) and (5, 920). We start by finding the rate of change.
[latex]\beginKeeping track of units can help us interpret this quantity. Income increased by $160 when the number of policies increased by 2, so the rate of change is $80 per policy. Therefore, Ilya earns a commission of $80 for each policy sold during the week.
We can then solve for the initial value.
[latex]\begin
The value of b is the starting value for the function and represents Ilya’s income when n = 0, or when no new policies are sold. We can interpret this as Ilya’s base salary for the week, which does not depend upon the number of policies sold.
We can now write the final equation.
[latex]I\left(n\right)=80n+520[/latex]Our final interpretation is that Ilya’s base salary is $520 per week and he earns an additional $80 commission for each policy sold.
We used units to help us verify that we were calculating the rate correctly. It makes sense to speak in terms of the price per policy. To calculate the initial value, we solved for b by substituting values from one of the points we were given for n and I. In the following video example we show how to identify the initial value, slope and equation for a linear function. https://youtu.be/JMQSdRFJ1S4 We will show one more example of how to write a linear function that represents the monthly cost to run a company given monthly fixed costs and production costs per item.
Suppose Ben starts a company in which he incurs a fixed cost of $1,250 per month for the overhead, which includes his office rent. His production costs are $37.50 per item. Write a linear function C where C(x) is the cost for x items produced in a given month.
Answer: The fixed cost is present every month, $1,250. The costs that can vary include the cost to produce each item, which is $37.50 for Ben. The variable cost, called the marginal cost, is represented by 37.5. The cost Ben incurs is the sum of these two costs, represented by [latex]C\left(x\right)=1250+37.5x[/latex].
It is important to note that we are writing a function based on monthly costs, so the initial cost will be $1,250 becuase Ben has to pay that amount monthly for rent. If Ben produces 100 items in a month, his monthly cost is represented by
[latex]\beginSo his monthly cost would be $5,000.
The following video example show how to write a linear function that represents how many miles you can travel in a rental car for a fixed amount. https://youtu.be/H8KR3w2nXqs
In the next example we will take data that is in tabular (table) form to write an equation that describes the rate of change in the numbers of a rat population.
The table below relates the number of rats in a population to time, in weeks. Use the table to write a linear equation.
| w, number of weeks | 0 | 2 | 4 | 6 |
| P(w), number of rats | 1000 | 1080 | 1160 | 1240 |
We can see from the table that the initial value for the number of rats is 1000, so b = 1000.
Rather than solving for m, we can tell from looking at the table that the population increases by 80 for every 2 weeks that pass. This means that the rate of change is 80 rats per 2 weeks, which can be simplified to 40 rats per week.
[latex]P\left(w\right)=40w+1000[/latex]If we did not notice the rate of change from the table we could still solve for the slope using any two points from the table. For example, using (2, 1080) and (6, 1240)
[latex]\beginIs the initial value always provided in a table of values like the table in the previous example? Write your ideas in the textbox below before you look at the answer. If your answer is no, give a description of how you would find the initial value. [practice-area rows="2"][/practice-area]
Answer: No. Sometimes the initial value is provided in a table of values, but sometimes it is not. If you see an input of 0, then the initial value would be the corresponding output. If the initial value is not provided because there is no value of input on the table equal to 0, find the slope, substitute one coordinate pair and the slope into [latex]f\left(x\right)=mx+b[/latex], and solve for b.